Have you wondered why a well-structured PPC strategy is so crucial for your Amazon performance?
You will find the answer in one of our clients' incredible journeys. In just 2 months, we transformed the brand from burning money needlessly to a stable and growing Amazon player. Over the next years months, we skyrocketed its performance with a full-funnel strategy.
Let's start with the basics.
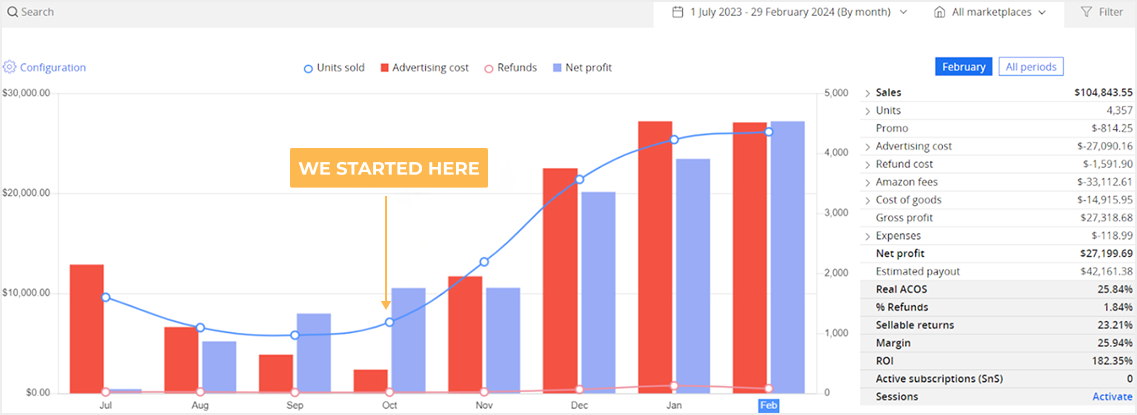
We started working with this business in the middle of October 2 years ago. The client has been selling on Amazon for nearly 3 years, but the brand wasn't performing very well.
1 YEAR BEFORE US

We started working with this business in the middle of October 2 years ago. The client has been selling on Amazon for nearly 3 years, but the brand wasn't performing very well.
1 YEAR BEFORE US
We started working with this business in the middle of October 2 years ago. The client has been selling on Amazon for nearly 3 years, but the brand wasn't performing very well.
1 YEAR BEFORE US
We started working with this business in the middle of October 2 years ago. The client has been selling on Amazon for nearly 3 years, but the brand wasn't performing very well.
1 YEAR BEFORE US
This Beauty & Personal Care brand was stuck. Despite solid organic sales and impressive profitability, they couldn’t break through a stubborn revenue plateau and they didn’t know which levers to pull to change that.
Their advertising performance was the clearest issue. Even with a well-known PPC tool in place, results were dismal: monthly ACoS ranged from 53% to 123%, and campaigns lacked structure, strategy, and direction.
You might wonder how this business has survived with these numbers.
One hidden driver was the Subscribe & Save (S&S) program. With just 536 subscribers, it already contributed 14% of total revenue, cushioning poor ad performance with steady, recurring sales. To scale, the brand needed to grow this base and S&S was one of the key levers to pull.
But the real foundation was product strength. The brand’s uniqueness made it stand out, so much so that even with a "bad PPC strategy," it remained highly profitable and firmly in the game.
In October, we made a full account audit of the business. Besides the poorly structured PPC advertising, the Product Detailed Pages of the brand had underoptimized listing copies, low to medium-quality infographics, and A+ content.
We started optimizing the account from A to Z:
We did a major overhaul of the advertising strategy:
This way we put more focus on ToS (Top - of - Search) keyword targeting and winning positions on the search results,
We started seeing the difference in organic ranking, thus improvement in sales, ACoS, and profit. As the brand was still relatively small when we started, our advertising structure emphasized growth first, profit second.
One month later, we decreased our ACoS from over 123% to 46%, and the account-level profit margin was over 21%.
In the 2nd month, our ACoS dropped to 40%, and our profit margin was over 23%.
We thought we had reached our best performance for the winter season, but we were wrong. This is not a seasonal product. Three months after we started, we hit over $ 100,000 in sales with a 23% profit margin and 42% ACoS.
For the first three months of our partnership, we successfully stabilized the account and maintained steady ACoS levels and profit margins, despite a significant increase in ad spend during the initial months of collaboration. We have reached a new status quo.
Around month 4 of working with AMZ Bees, the brand reached the beginning of its Growth phase, and we will keep this stage for at least several years to come.
Our goal is to utilize the market to its maximum potential - to optimize KW targeting, climb as high as possible in search results, and, of course, generate as much revenue as profitably as possible.
The 5th month was proof that this brand has the potential to reach its goal and much more.
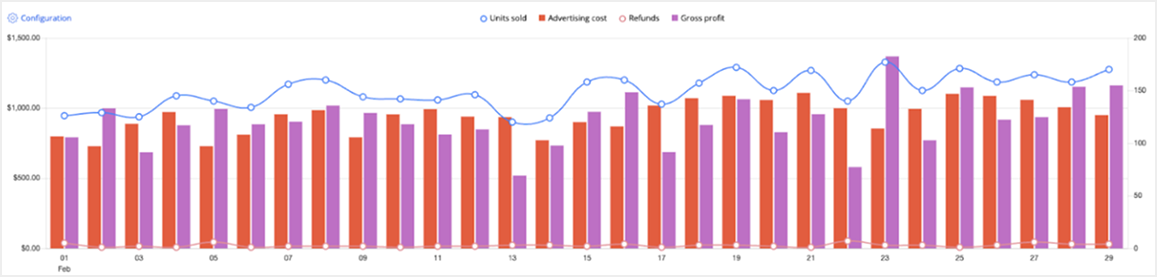
We registered new records and tested different strategies. They led us to over $ 104,000 in revenue and an average of a 25% profit margin. We even increased that number to 33% on February 23rd. On this day, we registered over $ 4,000 in daily sales.
Our goal was to keep this level of revenue for several months until the client can reorganize their cash flow and stop running out of stock, one of the biggest problems for most of the accounts we work with.
Another key factor for the initial growth of the brand and these results was the fact that we focused on relocating the ad spend from our best-selling products to secondary items experiencing growth.
Thanks to this move, we finished the 5th month with a 2x increase in sales for some of them, and we know this is a successful move for the brand.
Another strategy we tested during the same period was changing the main images for some of the secondary products. The factor that helped us was the small banner we added mentioning the product's key advantage.
Our strategy to focus on secondary products and optimize main images led us to a peak in impressions. Compared to January, when we had 5.2 million impressions, they increased by 10% in February, and we finished the month with 6 million impressions.
Regardless of new strategies and tests, we managed to maintain a stable account margin of over 25% and ACoS below 44%.
Month No. 6 was very intensive.
We experienced some great successes.
As I mentioned above, the secondary products were our main focus for the last month of Q1. Although we increased advertising spend for multiple products by 4% compared to the previous month, we also boosted sales velocity and managed to maintain a healthy profit margin of 24%-25%.
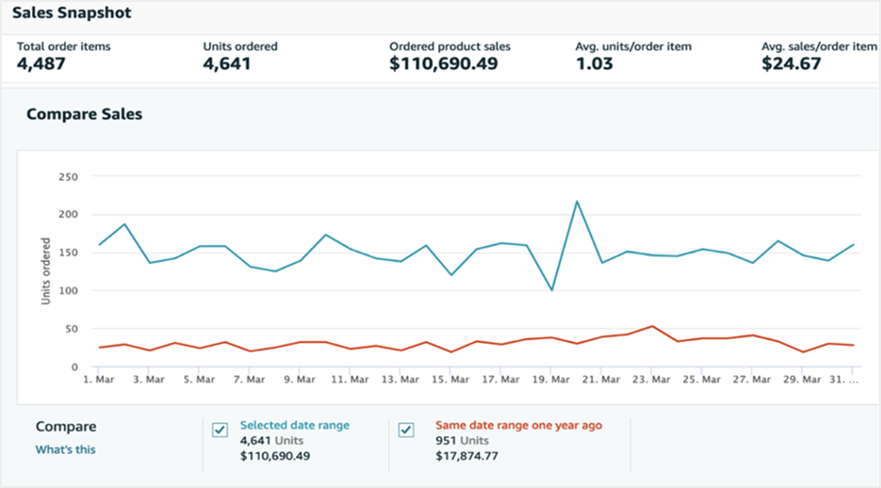
Our sales growth performance surpassed that of Month No. 5, and in the 6th one, we hit another record-breaking month, amounting to $110,690.49 in revenue, reflecting a 6% increase in sales.
The next step in our strategy was to test Lightning deals.
The results weren’t as good as we expected, as we sold only 50 units of our main best-selling product and several units of the secondary products we were focusing on. However, we received valuable data for the products.
At the 6th month of our common journey, we were excited to launch a new product, and here came one of the biggest issues we faced. Right after the launch, we lost the buy box.
This is where we faced our first issue.
The product launch and advertising ran correctly, but after just 2 sold units, Amazon revoked the buy-box from the listing.
Even though we didn’t have the buy-box back, we set up a VINE program for these products, and the first reviews have started coming in.
In addition, we've experienced a couple of instances of stock shortages on several products. Therefore, it is essential to maintain healthy stock levels, especially for products with aggressive advertising approaches.
Running out of stock is very dangerous for your brand’s growth and performance. It affects your rankings, rendering all your advertising investments useless and causing you to lose your organic and sponsored positions. Amazon now also charges sellers additional fees for low stock levels.
Throughout Month 6, we analyzed our main KWs search volume and the performance of our main variation over the past 90 days. The data showed a consistent, gradual decrease in searches and performance from the middle of Month 5 to the end of March. A low seasonality may have begun for this product.
Regardless, we increased ad spend on our secondary products by over 65% at the beginning of Month 6, and in the following week, ad spend was optimized. The significant decrease in search volume also contributed to the overall decrease in ad spend.
Our goal for the 1st year was to maintain the new revenue levels with incremental growth so the client can effectively organize their cash flow and manufacturing.
As our products progress through their lifecycle, we will be able to lower our TACoS (currently at ~26%) by a big margin; thus, when the products reach the “Cash-Cow phase,” they will be much more profitable
Although we are at the beginning of this brand's Amazon journey, we know the best for this client is yet to come.
One of the most significant achievements came in Q4 of our 1st year when we launched a new 16 oz product.
Being in a highly competitive niche, we knew that differentiation would be key. That’s why we focused heavily on the visual strategy for this item. The main image stood out with a luxurious and modern look, far more appealing than the old-school designs of most competitors. The unique vision we chose helped us immediately capture attention and boost CTR and conversions.
In October, we made a full account audit of the business. Besides the poorly structured PPC advertising, the Product Detailed Pages of the brand had underoptimized listing copies, low to medium-quality infographics, and A+ content.
We started optimizing the account from A to Z:
We did a major overhaul of the advertising strategy:
This way we put more focus on ToS (Top - of - Search) keyword targeting and winning positions on the search results,
We started seeing the difference in organic ranking, thus improvement in sales, ACoS, and profit. As the brand was still relatively small when we started, our advertising structure emphasized growth first, profit second.
One month later, we decreased our ACoS from over 123% to 46%, and the account-level profit margin was over 21%.
In the 2nd month, our ACoS dropped to 40%, and our profit margin was over 23%.
We thought we had reached our best performance for the winter season, but we were wrong. This is not a seasonal product. Three months after we started, we hit over $ 100,000 in sales with a 23% profit margin and 42% ACoS.
For the first three months of our partnership, we successfully stabilized the account and maintained steady ACoS levels and profit margins, despite a significant increase in ad spend during the initial months of collaboration. We have reached a new status quo.
Around month 4 of working with AMZ Bees, the brand reached the beginning of its Growth phase, and we will keep this stage for at least several years to come.
Our goal is to utilize the market to its maximum potential - to optimize KW targeting, climb as high as possible in search results, and, of course, generate as much revenue as profitably as possible.
The 5th month was proof that this brand has the potential to reach its goal and much more.
We registered new records and tested different strategies. They led us to over $ 104,000 in revenue and an average of a 25% profit margin. We even increased that number to 33% on February 23rd. On this day, we registered over $ 4,000 in daily sales.
Our goal was to keep this level of revenue for several months until the client can reorganize their cash flow and stop running out of stock, one of the biggest problems for most of the accounts we work with.
Another key factor for the initial growth of the brand and these results was the fact that we focused on relocating the ad spend from our best-selling products to secondary items experiencing growth.
Thanks to this move, we finished the 5th month with a 2x increase in sales for some of them, and we know this is a successful move for the brand.
Another strategy we tested during the same period was changing the main images for some of the secondary products. The factor that helped us was the small banner we added mentioning the product's key advantage.
Our strategy to focus on secondary products and optimize main images led us to a peak in impressions. Compared to January, when we had 5.2 million impressions, they increased by 10% in February, and we finished the month with 6 million impressions.
Regardless of new strategies and tests, we managed to maintain a stable account margin of over 25% and ACoS below 44%.
Month No. 6 was very intensive.
We experienced some great successes.
As I mentioned above, the secondary products were our main focus for the last month of Q1. Although we increased advertising spend for multiple products by 4% compared to the previous month, we also boosted sales velocity and managed to maintain a healthy profit margin of 24%-25%.
Our sales growth performance surpassed that of Month No. 5, and in the 6th one, we hit another record-breaking month, amounting to $110,690.49 in revenue, reflecting a 6% increase in sales.
The next step in our strategy was to test Lightning deals.
The results weren’t as good as we expected, as we sold only 50 units of our main best-selling product and several units of the secondary products we were focusing on. However, we received valuable data for the products.
At the 6th month of our common journey, we were excited to launch a new product, and here came one of the biggest issues we faced. Right after the launch, we lost the buy box.
This is where we faced our first issue.
The product launch and advertising ran correctly, but after just 2 sold units, Amazon revoked the buy-box from the listing.
Even though we didn’t have the buy-box back, we set up a VINE program for these products, and the first reviews have started coming in.
In addition, we've experienced a couple of instances of stock shortages on several products. Therefore, it is essential to maintain healthy stock levels, especially for products with aggressive advertising approaches.
Running out of stock is very dangerous for your brand’s growth and performance. It affects your rankings, rendering all your advertising investments useless and causing you to lose your organic and sponsored positions. Amazon now also charges sellers additional fees for low stock levels.
Throughout Month 6, we analyzed our main KWs search volume and the performance of our main variation over the past 90 days. The data showed a consistent, gradual decrease in searches and performance from the middle of Month 5 to the end of March. A low seasonality may have begun for this product.
Regardless, we increased ad spend on our secondary products by over 65% at the beginning of Month 6, and in the following week, ad spend was optimized. The significant decrease in search volume also contributed to the overall decrease in ad spend.
Our goal for the 1st year was to maintain the new revenue levels with incremental growth so the client can effectively organize their cash flow and manufacturing.
As our products progress through their lifecycle, we will be able to lower our TACoS (currently at ~26%) by a big margin; thus, when the products reach the “Cash-Cow phase,” they will be much more profitable
Although we are at the beginning of this brand's Amazon journey, we know the best for this client is yet to come.
One of the most significant achievements came in Q4 of our 1st year when we launched a new 16 oz product.
Being in a highly competitive niche, we knew that differentiation would be key. That’s why we focused heavily on the visual strategy for this item. The main image stood out with a luxurious and modern look, far more appealing than the old-school designs of most competitors. The unique vision we chose helped us immediately capture attention and boost CTR and conversions.
The results exceeded even the most optimistic expectations:
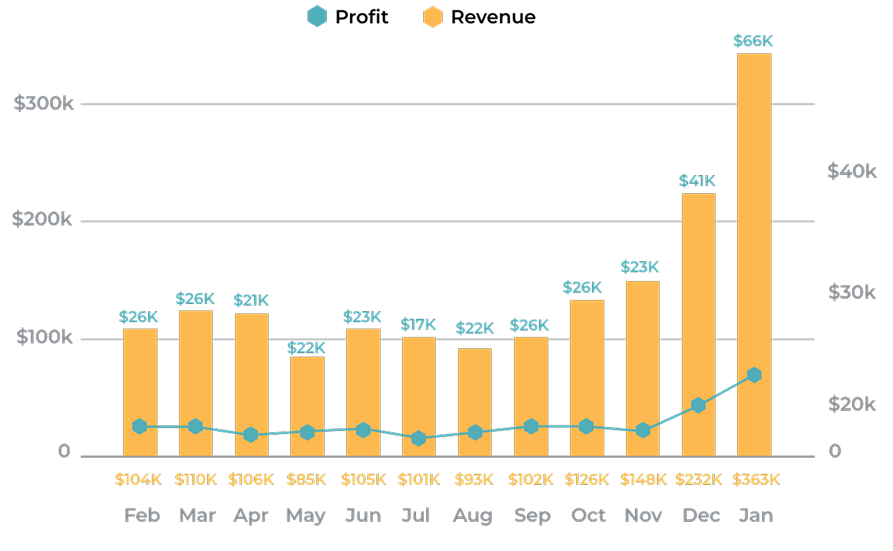
In just four months, this single product generated over $108,000 in revenue – a remarkable performance for a new listing in such a crowded space.
But our new product’s success didn’t stand alone – it had a ripple effect across the entire account. Next January became our best-performing month, with over $360,000 in total revenue:

We expanded our strategy in Q4 of 1ˢᵗ year and the early Q1 of the 2ⁿᵈ year:
These changes led to an average conversion rate of ~20%, with increased CTR across multiple listings.
We also captured additional market share by targeting keywords related to our new product, commonly used in wellness routines. This allowed us to tap into cross-niche demand and boost overall visibility and sales.
While we did update A+ content across some listings, the core growth drivers were:
We experienced stock shortages at the end of Year 1 and launch time, but quickly scaled to maintain over 20,000 units in storage. This ensured we didn’t lose momentum due to low inventory – something that has historically been a major barrier to growth.
The client initially expected to sell 500–600 units in the first month with us. We started our 2ⁿᵈ Year together with 30 times that.
20 MONTHS AFTER AMZ BEES BEGAN
The market proved ready, and we were prepared to take full advantage of the opportunity.
The results exceeded even the most optimistic expectations:
In just four months, this single product generated over $108,000 in revenue – a remarkable performance for a new listing in such a crowded space.
But our new product’s success didn’t stand alone – it had a ripple effect across the entire account. Next January became our best-performing month, with over $360,000 in total revenue:
We expanded our strategy in Q4 of 1ˢᵗ year and the early Q1 of the 2ⁿᵈ year:
These changes led to an average conversion rate of ~20%, with increased CTR across multiple listings.
We also captured additional market share by targeting keywords related to our new product, commonly used in wellness routines. This allowed us to tap into cross-niche demand and boost overall visibility and sales.
While we did update A+ content across some listings, the core growth drivers were:
We experienced stock shortages at the end of Year 1 and launch time, but quickly scaled to maintain over 20,000 units in storage. This ensured we didn’t lose momentum due to low inventory – something that has historically been a major barrier to growth.
The client initially expected to sell 500–600 units in the first month with us. We started our 2ⁿᵈ Year together with 30 times that.
20 MONTHS AFTER AMZ BEES BEGAN
The market proved ready, and we were prepared to take full advantage of the opportunity.
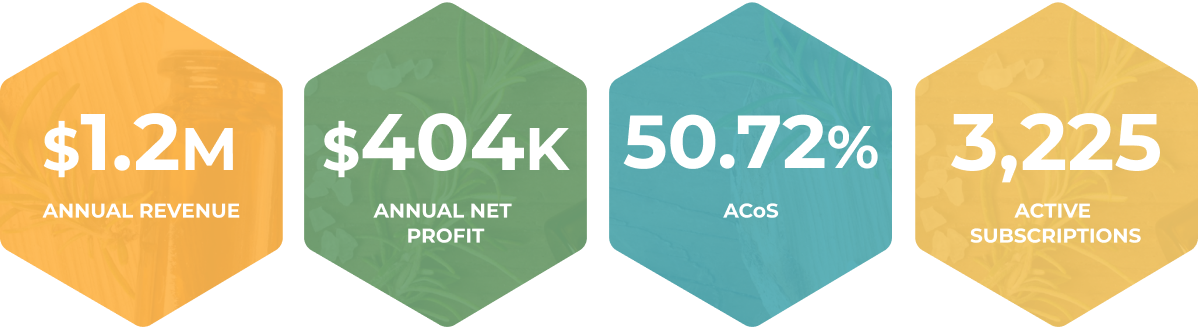
In just 20 months, we helped turn expectations into results: 30x initial projections, 3,225 active subscribers, and over $400K in profit.
By combining smart advertising, strong visuals, and tight inventory control, the brand broke through a crowded niche and claimed its space. The foundation is built. The growth continues.