We are the team you call when you’re ready to scale. But bold claims mean nothing without bold results.
In this case study, we’ll show you how AMZ Bees took a one-product brand from $500K/year to $30M/year on Amazon.
No gimmicks. No shortcuts. Just strategy, structure, and relentless execution.
We are the team you call when you’re ready to scale. But bold claims mean nothing without bold results.
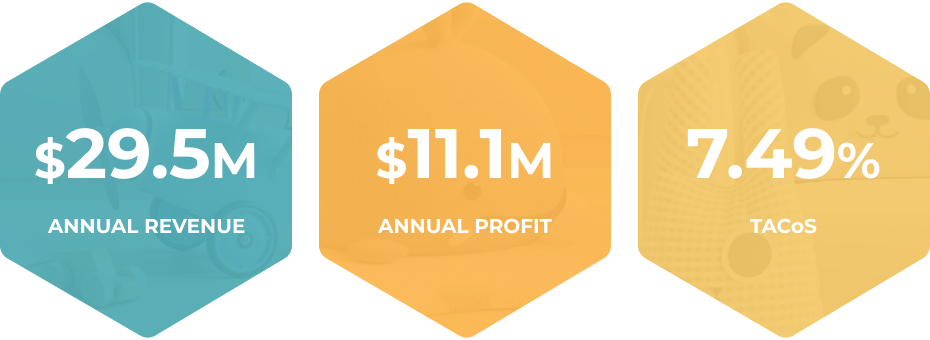
In this case study, we’ll show you how AMZ Bees took a one-product brand from $500K/year to $30M/year on Amazon.
No gimmicks. No shortcuts. Just strategy, structure, and relentless execution.
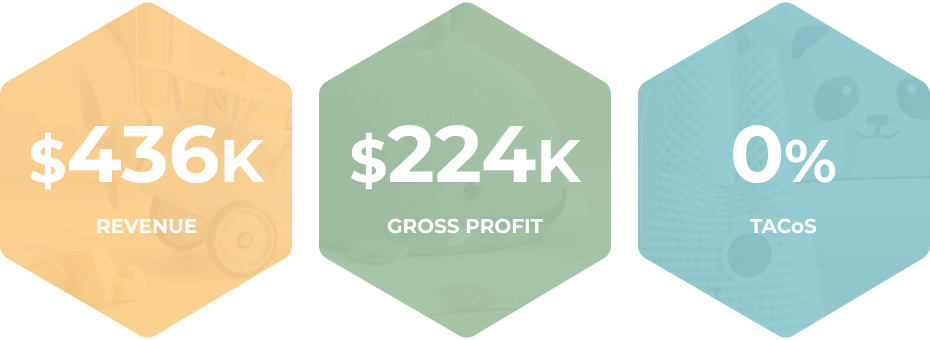
Our client is a one-product Private Label brand in the Toys & Games category, with a unique and patented product that appeals to a very broad audience. While the product itself had strong commercial potential, the brand's Amazon presence was weak and messy. We started working with them a few years ago on June 1st.
Initially, listings were scattered and some variants were even suspended. The content wasn't optimized, and there was no Amazon advertising strategy in place to drive growth (only external marketing).
Despite this, the product was generating ~$30K/month, which was evidence of untapped growth potential.
We began our partnership by laying the foundations for long-term success.
1 YEAR BEFORE AMZ BEES
The brand’s early success masked several deep-rooted issues:
A big early setback happened when Amazon mistakenly labeled a best-selling ASIN as a Japan-only product. This led to its global deactivation, resulting in over $1,500/day in lost profit.
The brand’s early success masked several deep-rooted issues:
A big early setback happened when Amazon mistakenly labeled a best-selling ASIN as a Japan-only product. This led to its global deactivation, resulting in over $1,500/day in lost profit.
Year 0 (June - December): Building solid foundations and resolving basic structural gaps:
We began by unblocking several listings and connecting everything under one variation. This allowed us to focus on the parent rather than the multiple-child ASINs.
We understood that quality optimization matters. So, we explored back-end SEO, like search terms, filters, GL categories and browse node corrections. Then, we began to test PPC gradually.
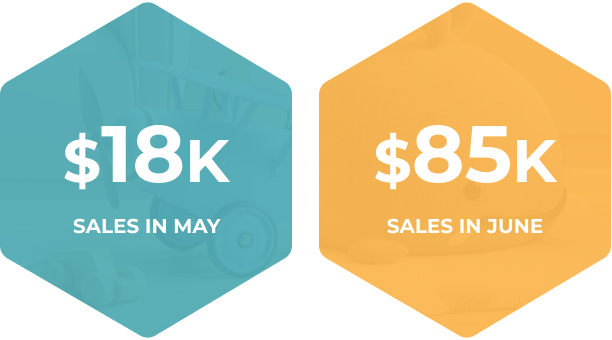
Our strategy was to start with a few dozen 2nd-level PPC campaigns, which helped us 4x the brand’s sales in the first month to $85K.
Before moving to the 2nd PPC level, it is important to mention the start: 1st level of PPC optimization. I have used it at the very beginning of my career back in 2015. And it worked. But times and Amazon’s algorithm have changed.
It’s the simplest, but unfortunately, most inefficient strategy. The 1st-level structure consists of 1 PPC campaign, with only 1 ad group. This particular ad group has 1 set of keywords with 3 different match types: exact, phrase, and broad. This means that if you want to target 25 keywords, we will add 75 keyword targets within the ad group.
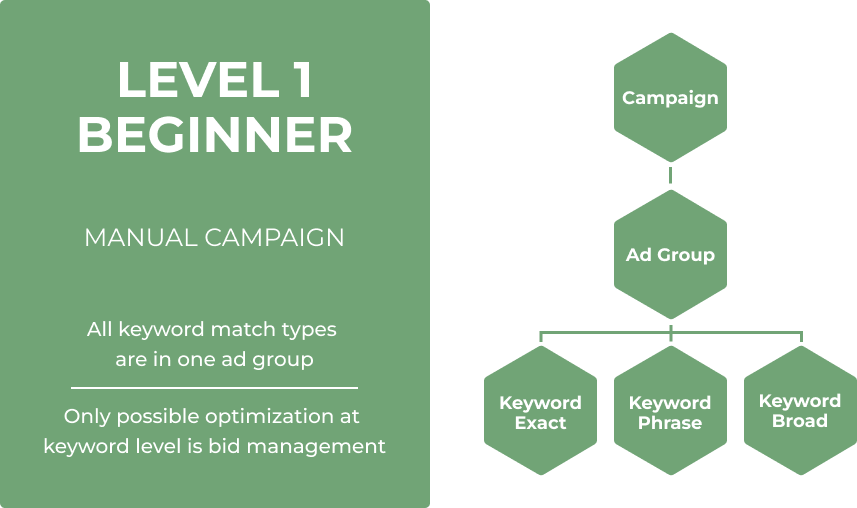
Everything is mixed in one place. That being said, if you want to optimize placements, you optimize placements for everything.
Unfortunately, you can’t optimize negative targeting properly because the KWs in all match types are targeting each other. As a result, the data is a mess.
Let’s get back to the 2nd level of optimization.
This advertising level provides you with one campaign, featuring an ad group for each match type: exact, phrase, and broad
(3 ad groups in total). It helps you understand each match type’s performance better and optimize general bids easily.

You can also negate the keywords properly because the different match types are separated. Thus, broad and phrase campaigns would not target the exact match keywords.
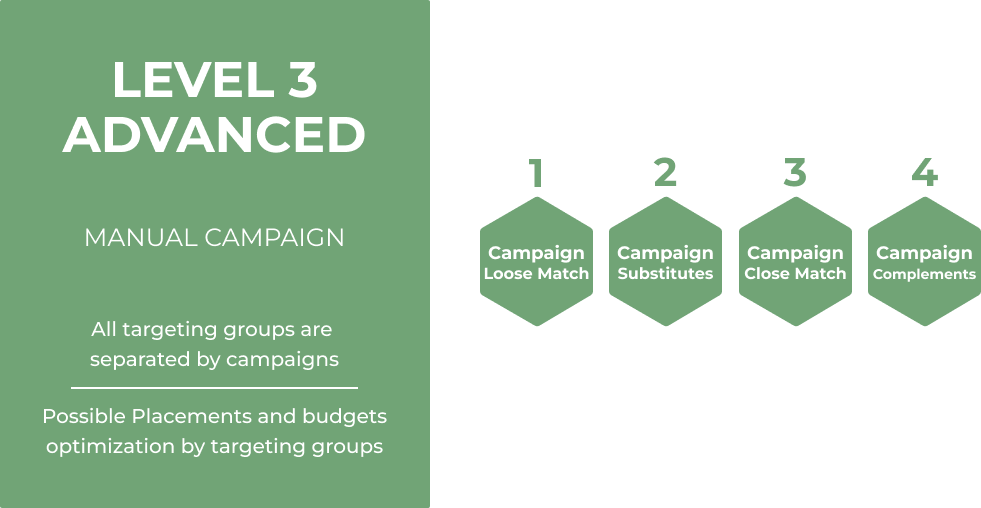
Typically, the auto campaign consists of 1 ad group, with 4 targeting groups "hidden" within. At the 2nd level within 1 campaign, you create 4 ad groups for each different targeting group: close match, loose match, substitutes, and complements.

Thanks to the 3rd level of optimization, you can see exact search terms for each targeting group. This helps you to optimize the negations, targeting group bids, and understand the data more easily.
The 3rd level of optimization enables us to build not one, but three campaigns for the same keyword set.
Each campaign consists of one ad group and one set of keywords, including exact, broad, and phrase campaigns. You can optimize placements, budgets, and bidding strategies for every keyword match type
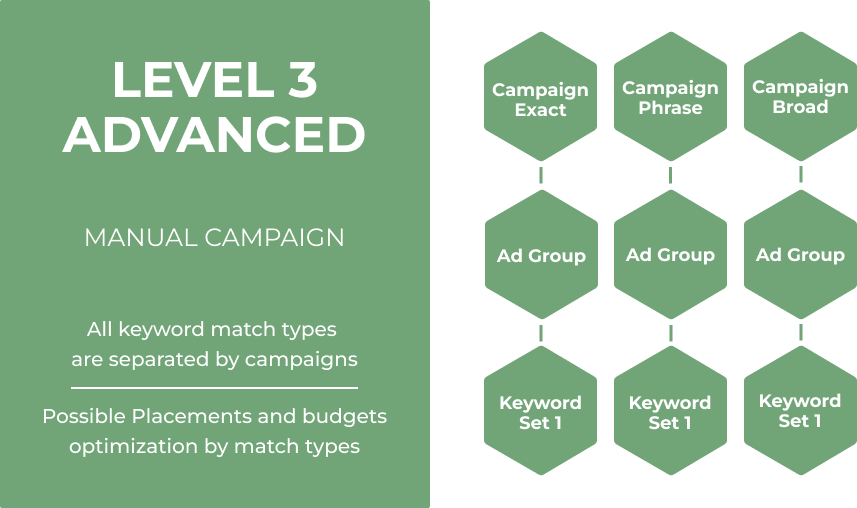
You can also segment every match type and separate them into different campaigns. This is where you have an excellent understanding of the performance of each match type and keyword set.
For this structure, you can run 4 automatic campaigns. Each auto campaign targets a different target group
This means that you can optimize placements, budgets, and bidding strategies for each targeting group separately. It is the maximum level that is humanly possible to optimize at scale.
Our ad spending increased, but this only helped us gather more keywords in preparation for Q4.
As our sales increased, we started facing massive stock-outs.
Thankfully, our partners have seen the potential and started ramping up production.
Q4 was incredibly challenging but also rewarding.
We managed to get the best-seller badge and move into the top 100 of our main category. This resulted from our well-built structure for all advertising types with constant everyday testing, improved listing quality, and relatively OK stock limits. They weren’t enough, though.
One month before the end of Q4, we were 70% out of stock. Fortunately, our manufacturer has offered an excellent option to solve this issue. We managed to ship a 4-unit variation from China. We were charging $15 in additional shipping charges when the product cost $80-85.
People still bought out our total capacity every single day. Because we didn’t have a proper FBM shipping structure, all orders had to be filled manually.
Amazon was labeling our products, which was also expensive at scale.
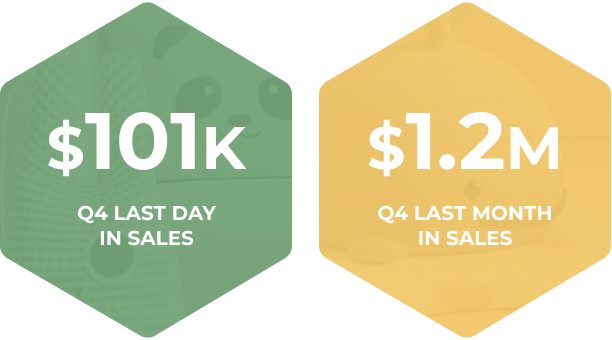
We faced suspensions due to “dangerous materials” and stock problems. Still, we ended Q4 with a strong $100K sales day after a national TV feature
Year 1: Growth Phase
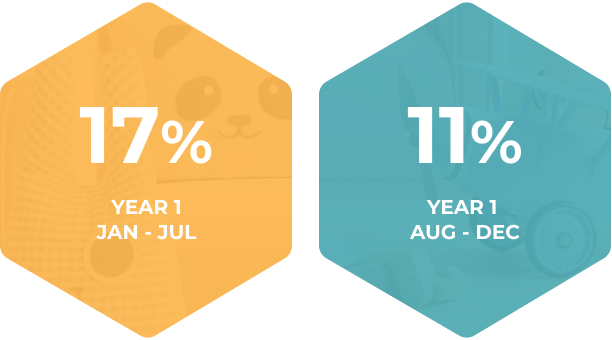
Unfortunately, we faced stock limitations until the end of Q3 of our 1st year, which slowed Q1 and Q2.
We use the time for planning and incorporating new strategies. We were dedicated to this process during Q1 of our 1st year.
We learned that we MUST have a Prime Exclusive Discount going during these types of holidays in our category. Still, we had a solid $86k day.
By Q3, we implemented the 1st-level PPC structure and joined Amazon Launchpad, which was a real game-changer. This unlocked Premium A+ content and SAS support that would later improve our stock limits for the estimated $6M Q4.
This advertising structure consists of one campaign with one ad group and one target (keyword or ASIN) per campaign. Amazon allows you to optimize every single target to its absolute maximum, not only weekly, but also hourly.
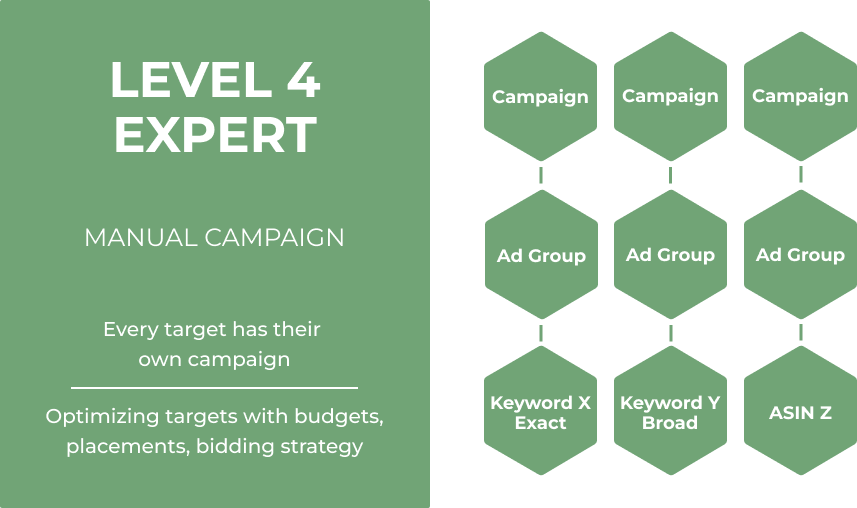
It's possible to optimize placements, budgets, and bidding strategies for each target.
This also allows you to see the exact Top-of-Search Impression Share (ToS IS) for every targeted keyword or ASIN. Thanks to ToS IS data, you know whether to continue pushing the target or pull it back.
It took us about two months to prepare stunning Premium A+ content that converted about 15% better than the old one. We joined all available Launchpad promotional programs.
At the beginning of Q3, we launched DSP campaigns focused on retargeting, which generated $1.5M at a 10% ACoS.
By the end of Q3, we finally fully upgraded to the 1st optimization level.
The performance was noticeable after the first month, and our ACoS has quickly shrunk from 15-20% to our new normal (10-12% ACoS). We reached peak optimization WHILE not pushing due to stock issues. We were never entirely in stock
One month before the end of Q3, we had fully upgraded campaigns. ACoS fell to 10–12% while keeping a conservative stock push. We introduced new designs and two-level variations, generating an additional $1.2M.
In Q4, we scaled aggressively. With over 7,500 campaigns live, we tested everything:
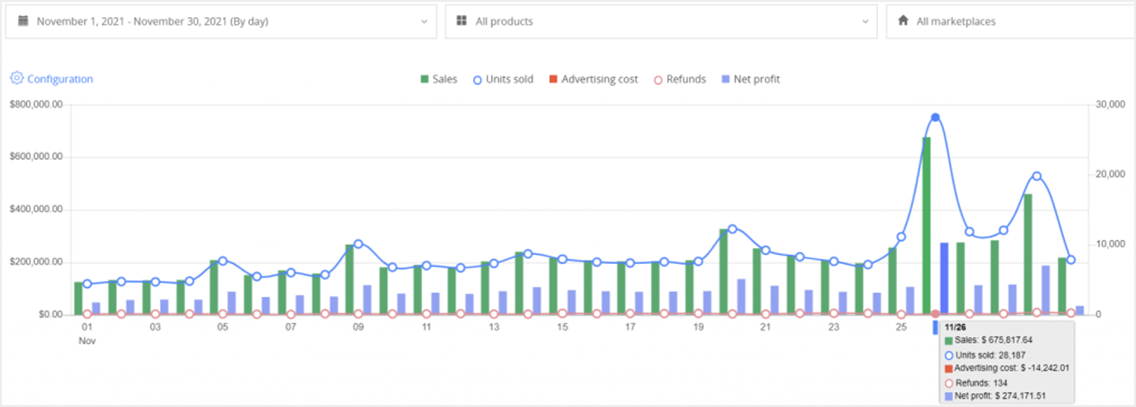
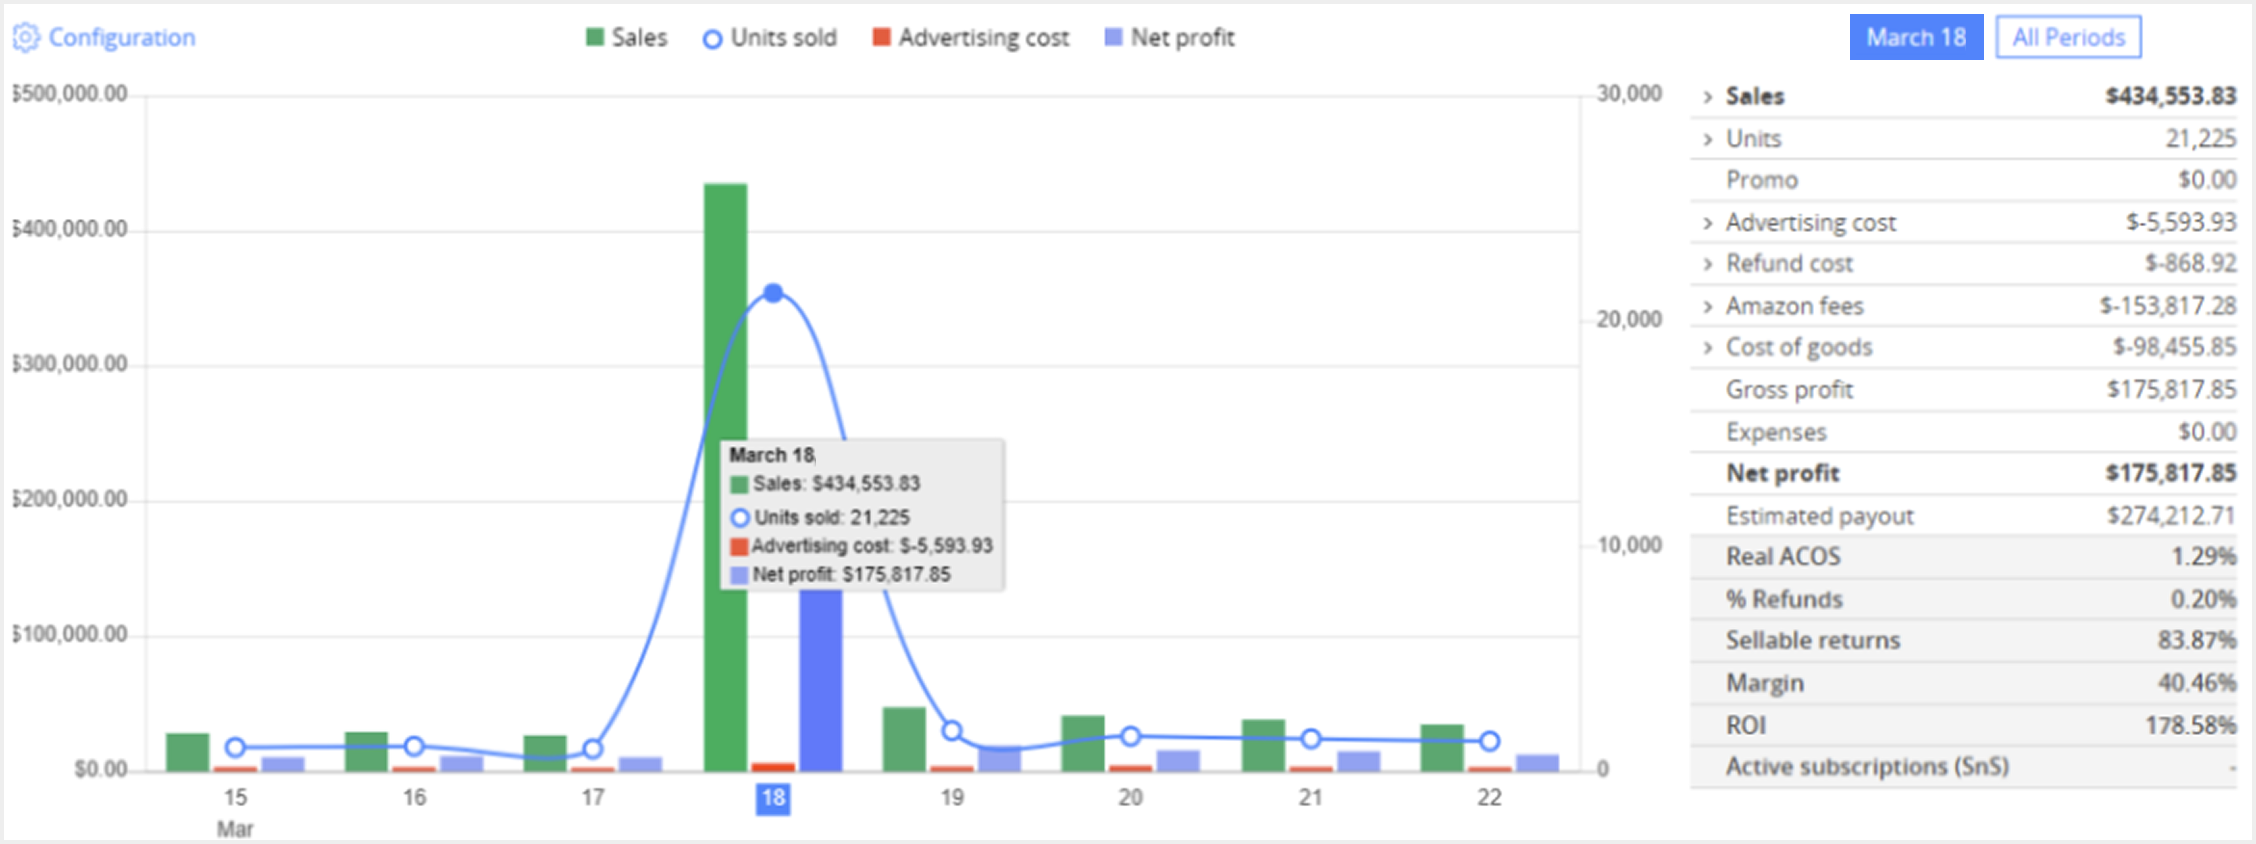
By the first month of Q4, we had already surpassed the $ 10M/year goal. On Black Friday, we reached $675,000 in just one day.
The last month of Q4 was relatively quiet. We stopped running lightning deals. Amazon has started selling some of our products at 20% lower prices, thus taking away our Buy box or forcing us to lower the price.
After selling all the inventory they had for 2 of our ASINs, they took our Buy box away and forced us to lower the price. We didn't. This problem resolves itself over time, but it occasionally reappears.
In the middle of the last month of year 1, we appeared on national TV again and sold 95% of our remaining stock. We generated a total of $ 2,338,847 in sales.
We spent the rest of the month slowing our campaigns. We wanted to avoid wasting our ad budget. Sending traffic to products that could only be delivered after Christmas or next year didn't make sense.
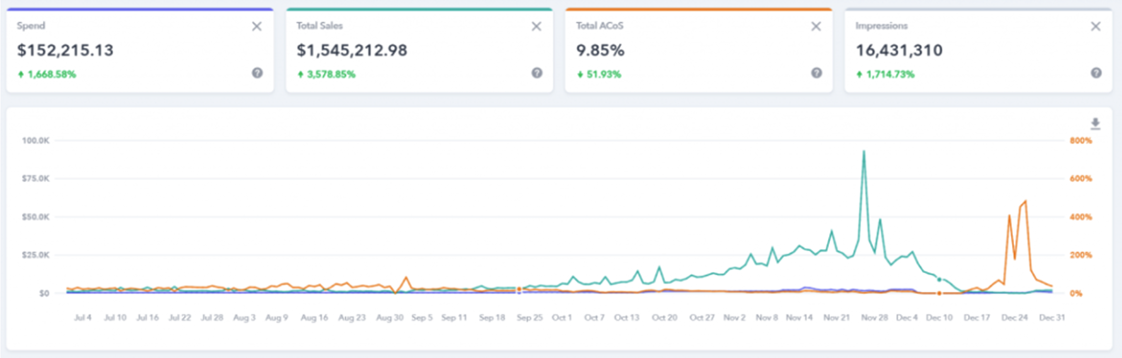
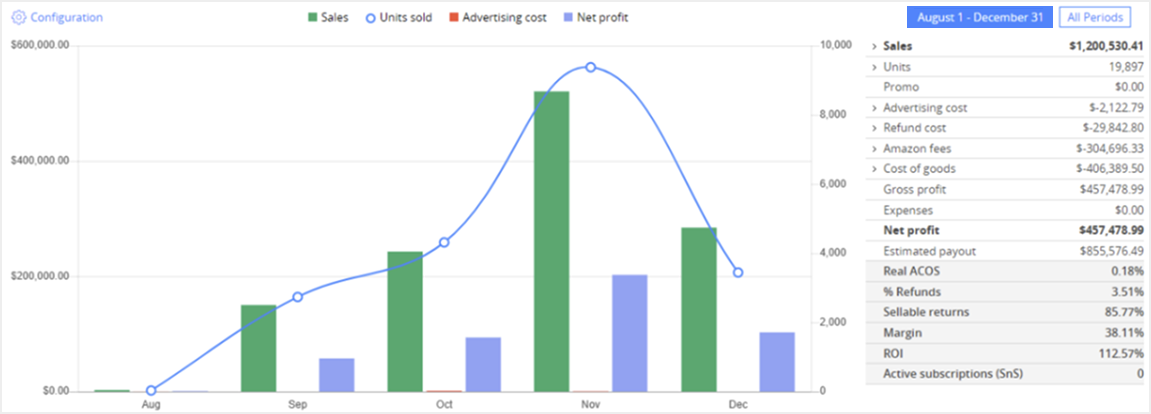
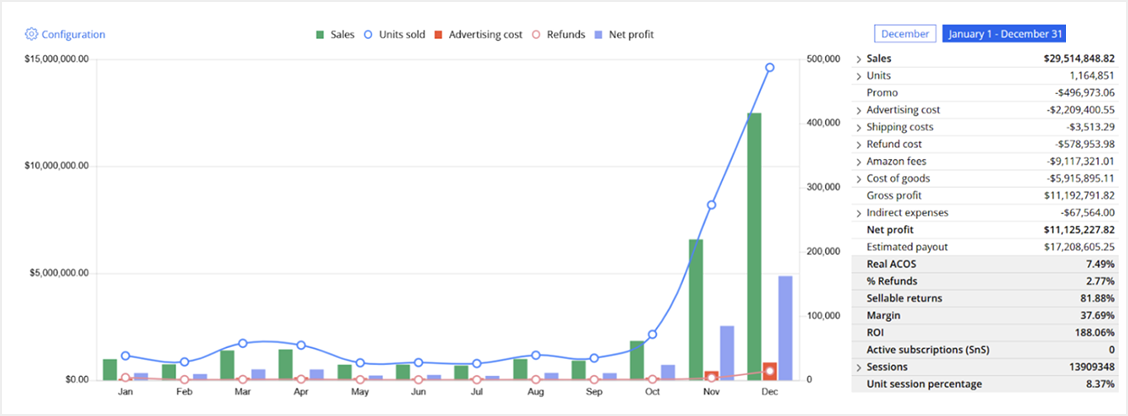
This is how our 1ST FULL YEAR WORKING TOGETHER LOOKED:

Year 2: Our Best Year Yet
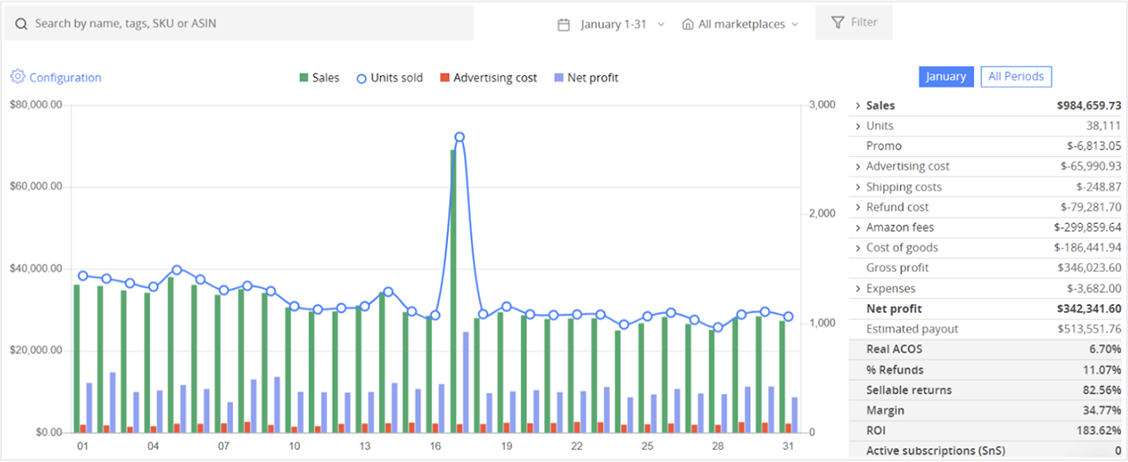
We began the second year of our partnership with nearly $1M in January sales, despite still struggling with inventory.
In the first 2 quarters, we:
October's Big Deals Day (Autumn's Prime Day) is usually not beneficial to us.
Here’s why:
Christmas shopping usually starts at the end of Q3 because customers are insecure about waiting 2.5 months until Black Friday to buy their presents at a lower price.
What if the items are out of stock?
In this case, that didn’t happen. This time, buyers knew there was no need to wait 2.5 months until Black Friday. They could shop 1.5 months prior to the 2nd Prime Day.
Even if they were not pleased with the Prime Day deals, there was only 1 more month until Black Friday.
This is why our Christmas sales usually begin after Black Friday.
In conclusion, despite many limits and technical problems, our second year was our best yet.
We’ve believe that we have reached each TOP that Amazon.com could offer us.
These combined efforts created the conditions for steady, scalable growth. Even as we navigated stock challenges, shifting Amazon rules, and changing buyer behavior, the brand continued to gain momentum, quickly reaching #1 in the Toys & Games category.
What followed exceeded every initial projection.
Year 0 (June - December): Building solid foundations and resolving basic structural gaps:
We began by unblocking several listings and connecting everything under one variation. This allowed us to focus on the parent rather than the multiple-child ASINs.
We understood that quality optimization matters. So, we explored back-end SEO, like search terms, filters, GL categories and browse node corrections. Then, we began to test PPC gradually.
Our strategy was to start with a few dozen 2nd-level PPC campaigns, which helped us 4x the brand’s sales in the first month to $85K.
Before moving to the 2nd PPC level, it is important to mention the start: 1st level of PPC optimization. I have used it at the very beginning of my career back in 2015. And it worked. But times and Amazon’s algorithm have changed.
It’s the simplest, but unfortunately, most inefficient strategy. The 1st-level structure consists of 1 PPC campaign, with only 1 ad group. This particular ad group has 1 set of keywords with 3 different match types: exact, phrase, and broad. This means that if you want to target 25 keywords, we will add 75 keyword targets within the ad group.
Everything is mixed in one place. That being said, if you want to optimize placements, you optimize placements for everything.
Unfortunately, you can’t optimize negative targeting properly because the KWs in all match types are targeting each other. As a result, the data is a mess.
Let’s get back to the 2nd level of optimization.
This advertising level provides you with one campaign, featuring an ad group for each match type: exact, phrase, and broad
(3 ad groups in total). It helps you understand each match type’s performance better and optimize general bids easily.
You can also negate the keywords properly because the different match types are separated. Thus, broad and phrase campaigns would not target the exact match keywords.
Typically, the auto campaign consists of 1 ad group, with 4 targeting groups "hidden" within. At the 2nd level within 1 campaign, you create 4 ad groups for each different targeting group: close match, loose match, substitutes, and complements.
Thanks to the 3rd level of optimization, you can see exact search terms for each targeting group. This helps you to optimize the negations, targeting group bids, and understand the data more easily.
The 3rd level of optimization enables us to build not one, but three campaigns for the same keyword set.
Each campaign consists of one ad group and one set of keywords, including exact, broad, and phrase campaigns. You can optimize placements, budgets, and bidding strategies for every keyword match type
You can also segment every match type and separate them into different campaigns. This is where you have an excellent understanding of the performance of each match type and keyword set.
For this structure, you can run 4 automatic campaigns. Each auto campaign targets a different target group
This means that you can optimize placements, budgets, and bidding strategies for each targeting group separately. It is the maximum level that is humanly possible to optimize at scale.
Our ad spending increased, but this only helped us gather more keywords in preparation for Q4.
As our sales increased, we started facing massive stock-outs.
Thankfully, our partners have seen the potential and started ramping up production.
Q4 was incredibly challenging but also rewarding.
We managed to get the best-seller badge and move into the top 100 of our main category. This resulted from our well-built structure for all advertising types with constant everyday testing, improved listing quality, and relatively OK stock limits. They weren’t enough, though.
One month before the end of Q4, we were 70% out of stock. Fortunately, our manufacturer has offered an excellent option to solve this issue. We managed to ship a 4-unit variation from China. We were charging $15 in additional shipping charges when the product cost $80-85.
People still bought out our total capacity every single day. Because we didn’t have a proper FBM shipping structure, all orders had to be filled manually.
Amazon was labeling our products, which was also expensive at scale.
We faced suspensions due to “dangerous materials” and stock problems. Still, we ended Q4 with a strong $100K sales day after a national TV feature
Year 1: Growth Phase
Unfortunately, we faced stock limitations until the end of Q3 of our 1st year, which slowed Q1 and Q2.
We use the time for planning and incorporating new strategies. We were dedicated to this process during Q1 of our 1st year.
We learned that we MUST have a Prime Exclusive Discount going during these types of holidays in our category. Still, we had a solid $86k day.
By Q3, we implemented the 1st-level PPC structure and joined Amazon Launchpad, which was a real game-changer. This unlocked Premium A+ content and SAS support that would later improve our stock limits for the estimated $6M Q4.
This advertising structure consists of one campaign with one ad group and one target (keyword or ASIN) per campaign. Amazon allows you to optimize every single target to its absolute maximum, not only weekly, but also hourly.
It's possible to optimize placements, budgets, and bidding strategies for each target.
This also allows you to see the exact Top-of-Search Impression Share (ToS IS) for every targeted keyword or ASIN. Thanks to ToS IS data, you know whether to continue pushing the target or pull it back.
It took us about two months to prepare stunning Premium A+ content that converted about 15% better than the old one. We joined all available Launchpad promotional programs.
At the beginning of Q3, we launched DSP campaigns focused on retargeting, which generated $1.5M at a 10% ACoS.
By the end of Q3, we finally fully upgraded to the 1st optimization level.
The performance was noticeable after the first month, and our ACoS has quickly shrunk from 15-20% to our new normal (10-12% ACoS). We reached peak optimization WHILE not pushing due to stock issues. We were never entirely in stock
One month before the end of Q3, we had fully upgraded campaigns. ACoS fell to 10–12% while keeping a conservative stock push. We introduced new designs and two-level variations, generating an additional $1.2M.
In Q4, we scaled aggressively. With over 7,500 campaigns live, we tested everything:
By the first month of Q4, we had already surpassed the $ 10M/year goal. On Black Friday, we reached $675,000 in just one day.
The last month of Q4 was relatively quiet. We stopped running lightning deals. Amazon has started selling some of our products at 20% lower prices, thus taking away our Buy box or forcing us to lower the price.
After selling all the inventory they had for 2 of our ASINs, they took our Buy box away and forced us to lower the price. We didn't. This problem resolves itself over time, but it occasionally reappears.
In the middle of the last month of year 1, we appeared on national TV again and sold 95% of our remaining stock. We generated a total of $ 2,338,847 in sales.
We spent the rest of the month slowing our campaigns. We wanted to avoid wasting our ad budget. Sending traffic to products that could only be delivered after Christmas or next year didn't make sense.
This is how our 1ST FULL YEAR WORKING TOGETHER LOOKED:
Year 2: Our Best Year Yet
We began the second year of our partnership with nearly $1M in January sales, despite still struggling with inventory.
In the first 2 quarters, we:
October's Big Deals Day (Autumn's Prime Day) is usually not beneficial to us.
Here’s why:
Christmas shopping usually starts at the end of Q3 because customers are insecure about waiting 2.5 months until Black Friday to buy their presents at a lower price.
What if the items are out of stock?
In this case, that didn’t happen. This time, buyers knew there was no need to wait 2.5 months until Black Friday. They could shop 1.5 months prior to the 2nd Prime Day.
Even if they were not pleased with the Prime Day deals, there was only 1 more month until Black Friday.
This is why our Christmas sales usually begin after Black Friday.
In conclusion, despite many limits and technical problems, our second year was our best yet.
We’ve believe that we have reached each TOP that Amazon.com could offer us.
These combined efforts created the conditions for steady, scalable growth. Even as we navigated stock challenges, shifting Amazon rules, and changing buyer behavior, the brand continued to gain momentum, quickly reaching #1 in the Toys & Games category.
What followed exceeded every initial projection.
2 YEARS AFTER AMZ Bees
2 YEARS AFTER AMZ Bees
This is what happens when great product-market fit meets operational precision.
We didn't just improve listings or run ads.
We built a long-term growth engine that could scale, adapt, and win. From broken variation structure and missed sales to advanced advertising, strategic inventory management, market expansion, and the BEST SELLING Toy on Amazon.com, the results speak for themselves.
It was never about one trick and tactic. It was about doing everything right, one step at a time.